Challenges, Strategies and Adaptations on Interactive Dashboards
Mohammed Alhamadi
Introduction
Interactive dashboards enable viewing and interacting with complex underlying data using visualisations such as charts, tables, maps, or even text typically on a single display. By bringing the most important information in a single place, dashboards enable performance monitoring and support decision making. Although nowadays dashboards are widely adopted in many domains, they involve challenges that prevent users from utilising them as they were intended. For example, having a dashboard with too much data can negatively affect decision making and lead to misleading interpretation. Through this research, we identify and investigate the challenges associated with dashboards, what users do in response to those challenges, and what adaptations can be applied to mitigate these challenges. Consequently, we aim to examine and evaluate a set of adaptation techniques that can improve the experience of users interacting with dashboards.
Research Questions
- What are the interaction and information presentation challenges users encounter when they interact with dashboards?
- What adaptations can be applied to dashboards? Which of these adaptations can be applied to address the problems found in RQ1.
- How can we intervene to adapt the user interface? Do the adaptations improve the interaction with dashboards?
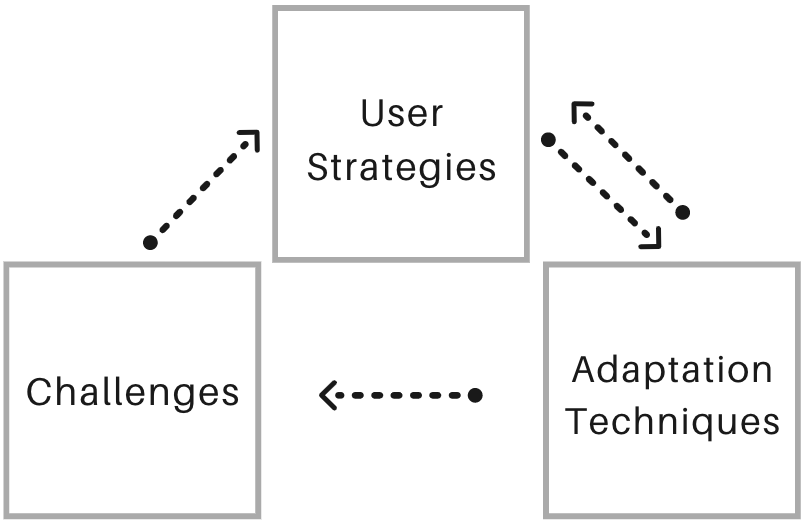
Identified Challenges
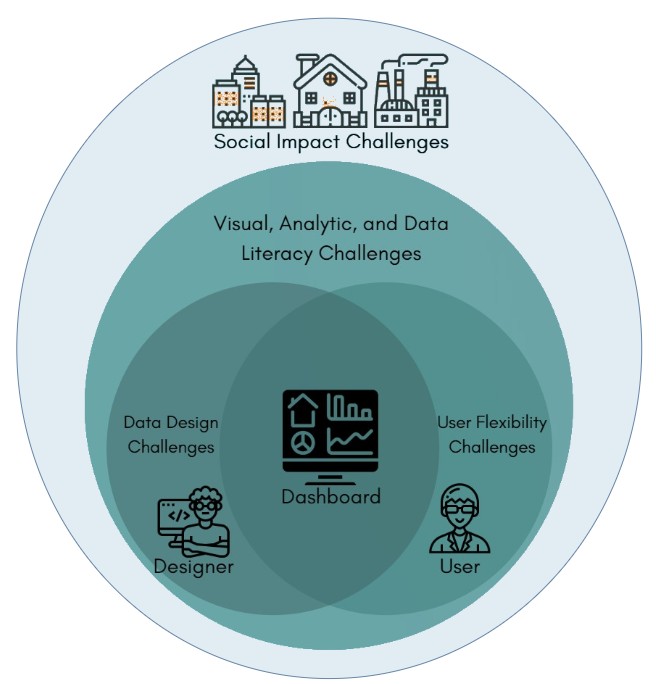
User Flexibility Challenges |
Visual, Analytical, and Data Literacy Challenges |
| Level of Detail Adjustment | Visual Literacy |
| User Adaptability | Analytic Literacy |
| Situation Adaptability | Data Literacy |
| System Integration | Ease of Use |
| Comparison Support | Dashboard Evaluation |
| … | … |
Data Design Challenges |
Social Impact Challenges |
| Data Oversimplification | Data-driven Thinking |
| Too Much Data | Added Value |
| Data Quality | Sharing, Security & Trust |
| Data Sources | Automation |
| Inaccurate Data Representation | Technology Resistance |
| … | … |
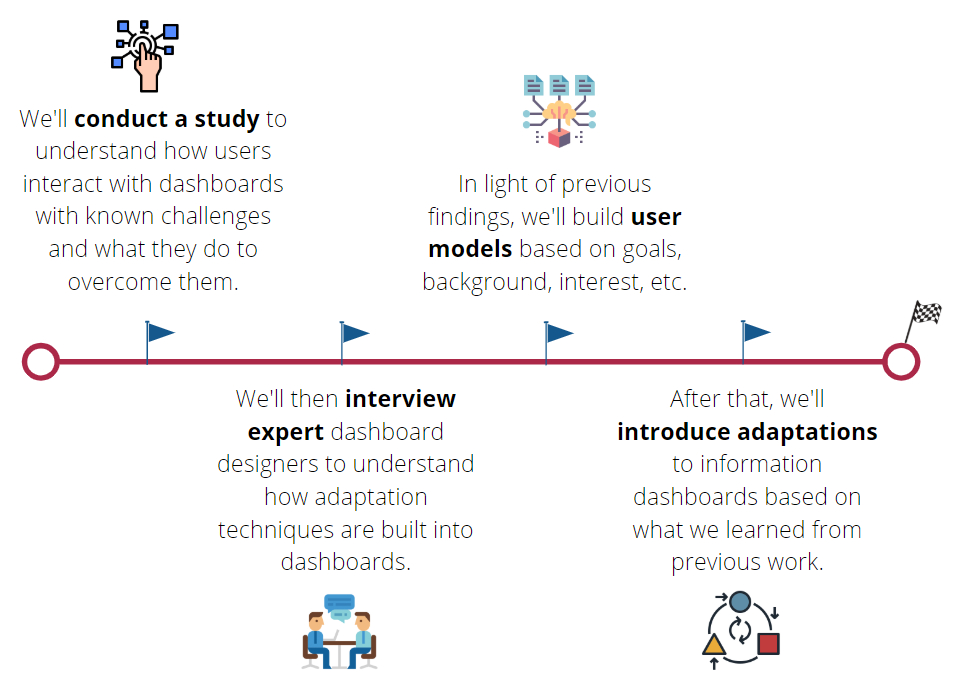
What’s Next?
https://doi.org/10.1145/3340631.3398678