Exploring Personalized University Ranking and Recommendation
Mehdi Elahi, Nabil El Ioini, Anna Alexander Lambrix, Mouzhi Ge
https://doi.org/10.1145/3386392.3397590
Motivation
Finding the right university to study is always a challenge for people due to the large number of universities worldwide. Although there exist a number of global university rankings, they provide non-personalized rankings as one-size-fits-all solution. This becomes an issue since different people may have different preferences and considerations in mind, when choosing a university to study.
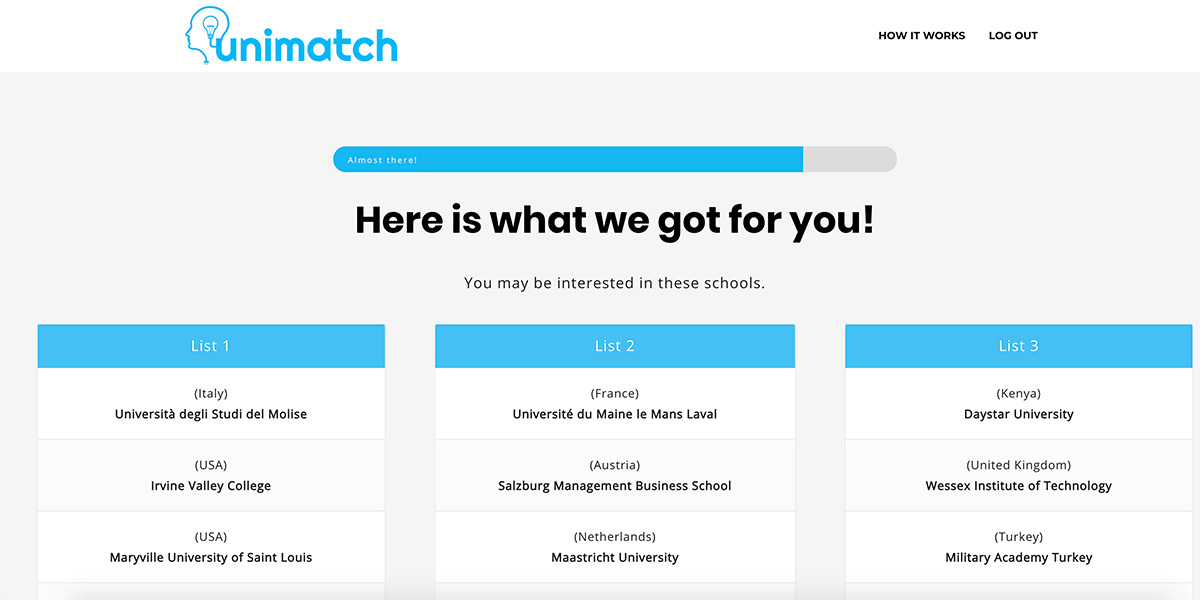
This poster presents a Recommender System that can generate a personalized ranking list based on users particular preferences. The system is capable of eliciting user preferences, provided as ratings for universities, building predictive models on the preference data, and generating a personalized university ranking list that is tailored to the particular preferences and needs of the users.
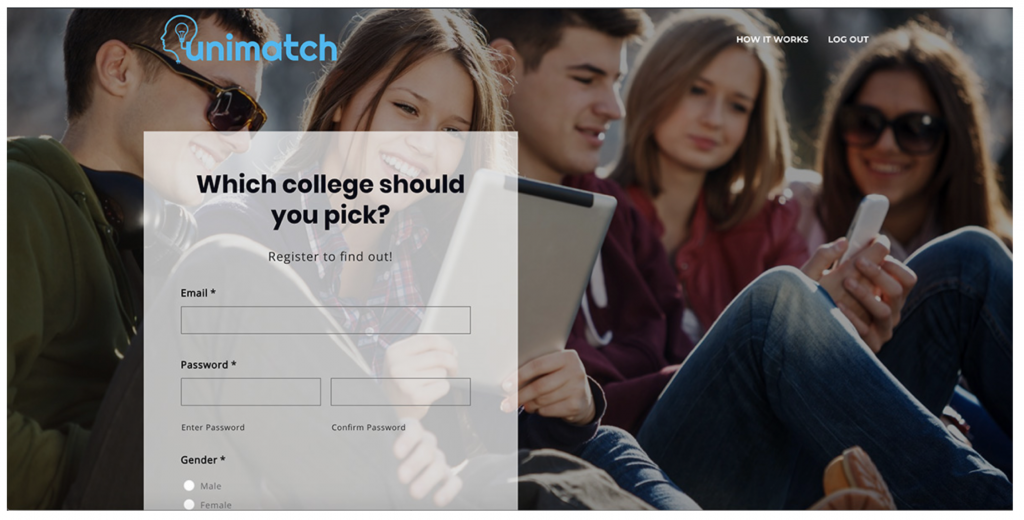
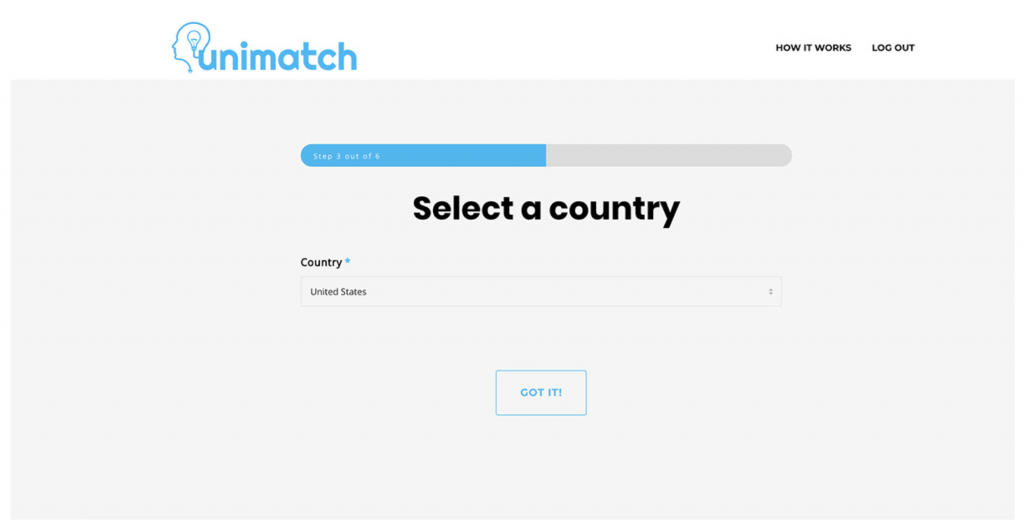
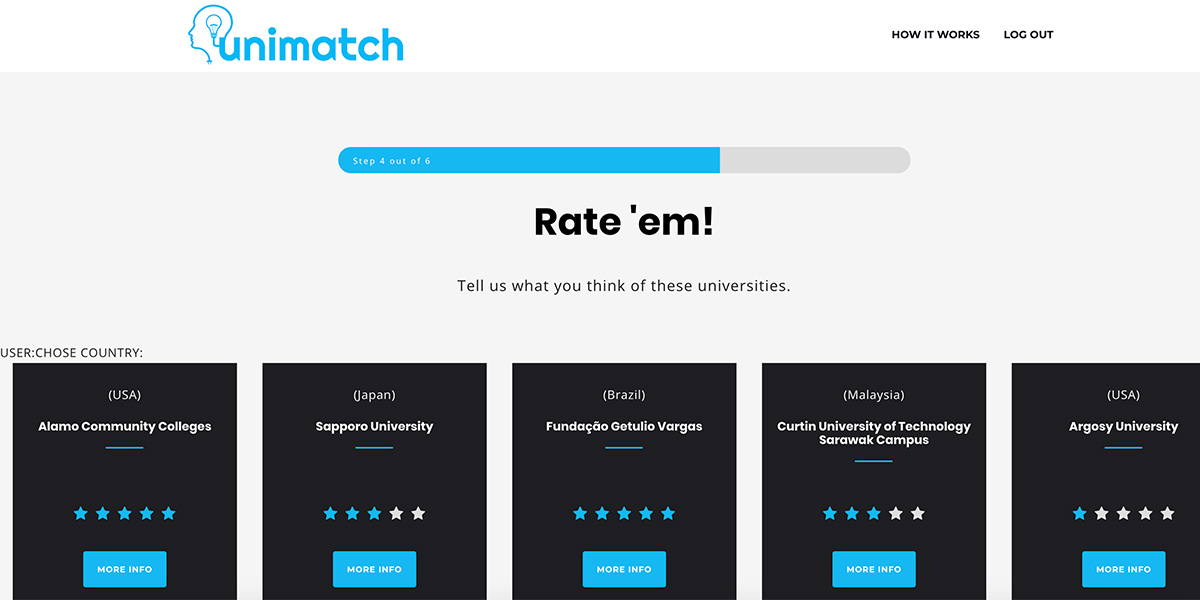
Preference Elicitation
Recommendation Model
We used Collaborative Filtering (CF) to generate recommendation. CF exploits ratings provided by a network of users in order to predict the missing ratings of the items. The items with the highest predicted ratings are recommended to users. Here we briefly describe the approaches based on CF.
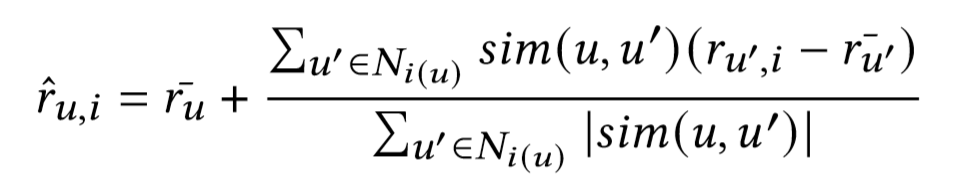
K-nearest neighbors (KNN): Neighbourhood-based this kind of algorithm such as k-nearest neighbors (KNN) computes rating prediction exploiting two sets of preference data: the ratings of the user for other items and the ratings of other like-minded users. The item’s rating prediction is computed based on how the item was rated by the users similar to the target user. The rating 𝑟ˆ𝑢,𝑖 for the user 𝑢 and the item 𝑖 is predicted in the following way.
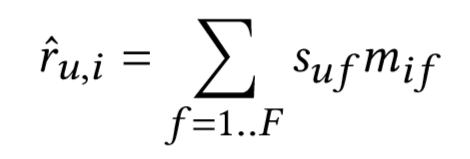
Matrix Factorization techniques such as SVD learns for both users and items factor vectors of the same size. Those vectors are inferred from the user’s rating. Each element of the factor vector, assigned to an item, reflects how well the item represents a particular latent aspect. User factor vectors measure the preference of the user for each factor. The task of the factorization is to split the matrix of ratings 𝑅 into two matrices S and M:
We also considered a number of techniques as baselines, including Co-Clustering, SlopeOne and Random recommendation.
Evaluation Results
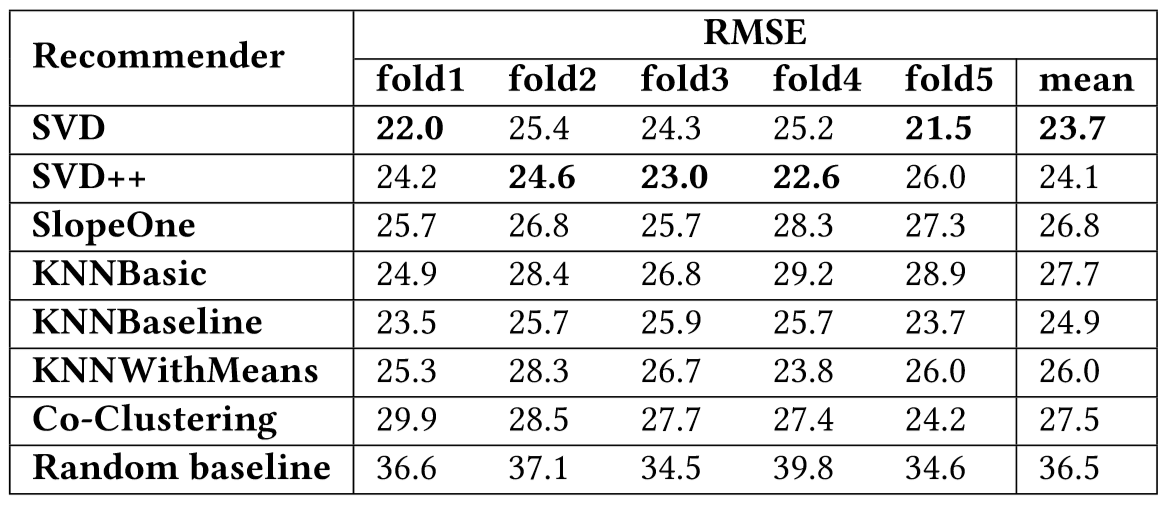
Offline Evaluation with RMSE: The best results have been achieved by SVD recommender algorithm. The overall RMSE value of SVD, computed by averaging the RMSE values of different folds, is 23.7. The next best recommender algorithm is SVD++ with the overall RMSE value of 24.1. As expected, the worse result is obtained by random baseline with the RMSE value of 36.5.
User Study: 67 respondents participated into our user study and 46 completed it. Among the respondents there were 50 males, 14 females and 3 people refused to disclose their gender. Majority of our respondents were between the age of 25 and 34 (37%), holding a Bachelor’s degree (73%) and they were from Italy, Russia or Germany. We adopted the System Usability Survey (SUS) that is a ten-item questionnaire based on a five-point Likert scale ranging from “strongly disagree” (1) to “strongly agree” (5). The full list of questions are provided here:
Q1: I think that I would like to use this recommender system for finding the right university. • Q2: I found the recommender system unnecessarily complex. • Q3: I thought the recommender system was easy to use. • Q4: I think that I would need the support of a technical person to be able to use this recommender system. • Q5: I found the various functions in this recommender system were well integrated. • Q6: I thought there was too much inconsistency in this recommender system. • Q7: I would imagine that most people would learn to use this recommender system very quickly. • Q8: I found the recommender system very cumbersome to use. • Q9: I felt very confident using the recommender system to find my preferred university. • Q10: I needed to learn a lot of things before I can get going with the recommender system.
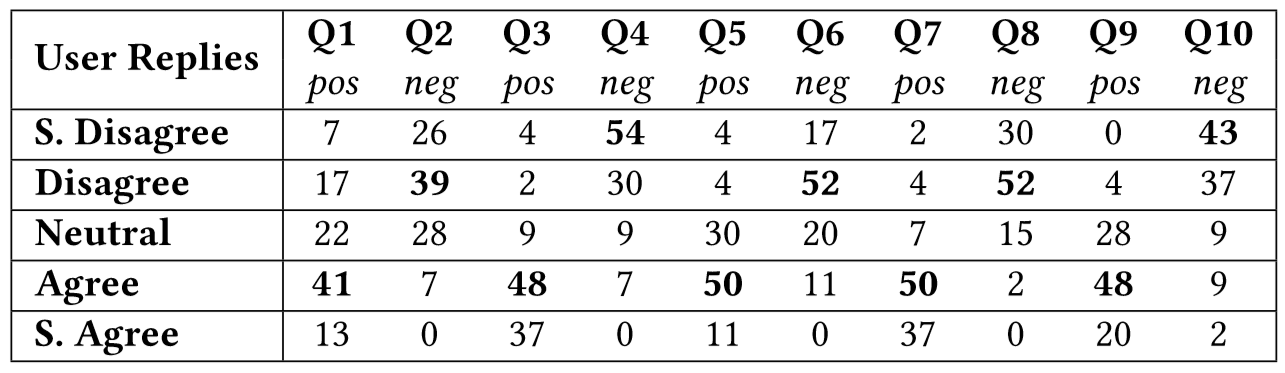
We note that the average SUS score computed in a benchmark of 500 studies is 68. The survey questions are listed here: The user study results obtained from SUS showed that our respondent’s have assessed usability of our system higher than the benchmark (i.e., 68). While the actual values given by users ranged from 42.5 (lowest) to 100 (highest), the average was 72.9 with a median score of 75.